Difference between revisions of "Norwich, United Kingdom Statistics"
From Geohashing
imported>Sourcerer (→Norwich Stats) |
imported>Sourcerer m (→Consecutive Hashpoints in Norwich) |
||
| Line 16: | Line 16: | ||
[[File:Norwich Stats.png]] | [[File:Norwich Stats.png]] | ||
| + | |||
| + | |||
| + | This [http://stattrek.com/online-calculator/binomial.aspx CALCULATOR] was used to generate the statistics above. | ||
Revision as of 15:33, 18 August 2015
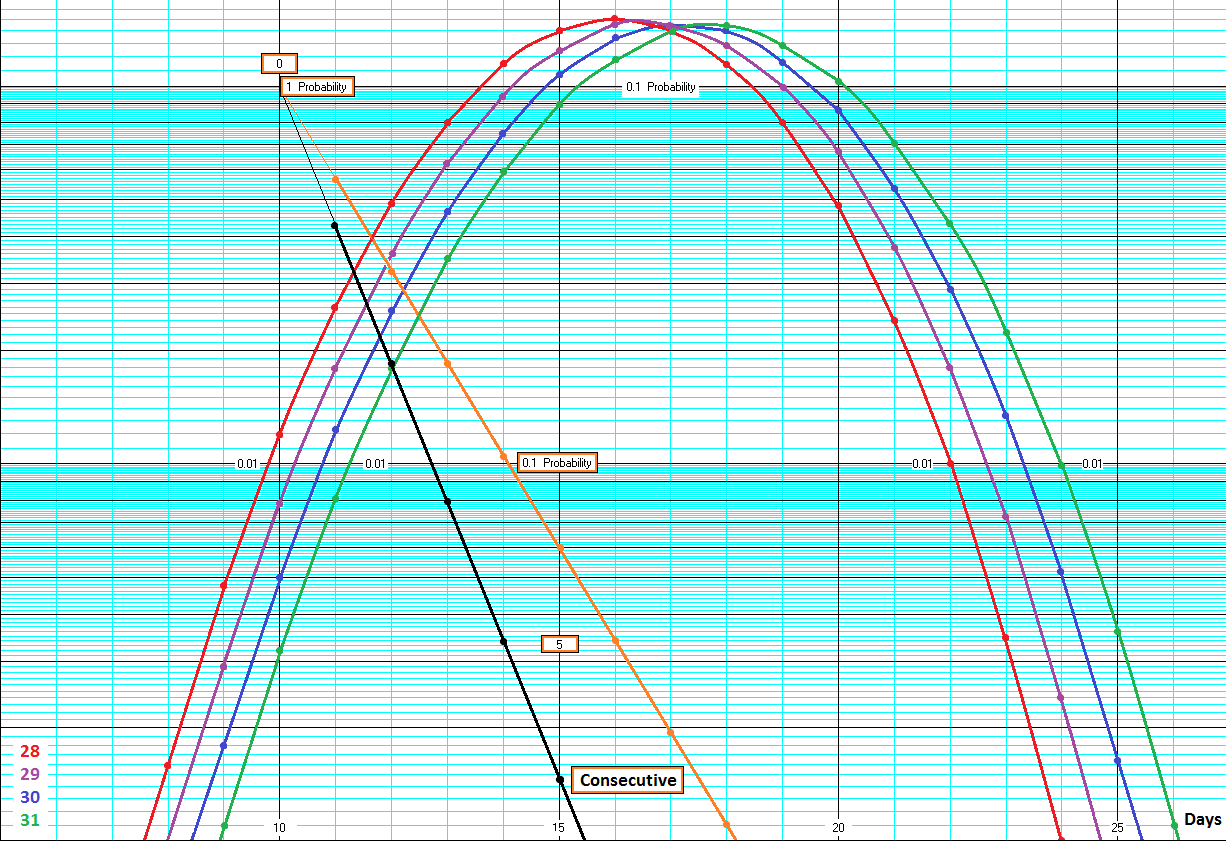
The graph below shows the probabilities of ...
- Blue: Getting a certain number of land hashpoints in a 30 day month.
- Orange: Getting an unbroken sequence of consecutive land hashpoints in the Norwich graticule.
This graph is based on a 30 day month and assumes the land area is 0.57 or 57%.
Land Hashpoints
- There is a probability of less than 1 in 1000 of getting fewer than 9 land hashpoints or more than 25.
Consecutive Hashpoints in Norwich
- The probability of four consecutive hashpoints is about 1:10.
- Getting more than eight consecutive hashpoints, you are down below 1:100.
This CALCULATOR was used to generate the statistics above.
