File:2020-04-29 62 29 18-map.png
From Geohashing
Size of this preview: 800 × 600 pixels. Other resolutions: 320 × 240 pixels | 1,600 × 1,200 pixels.
Original file (1,600 × 1,200 pixels, file size: 976 KB, MIME type: image/png)
Summary
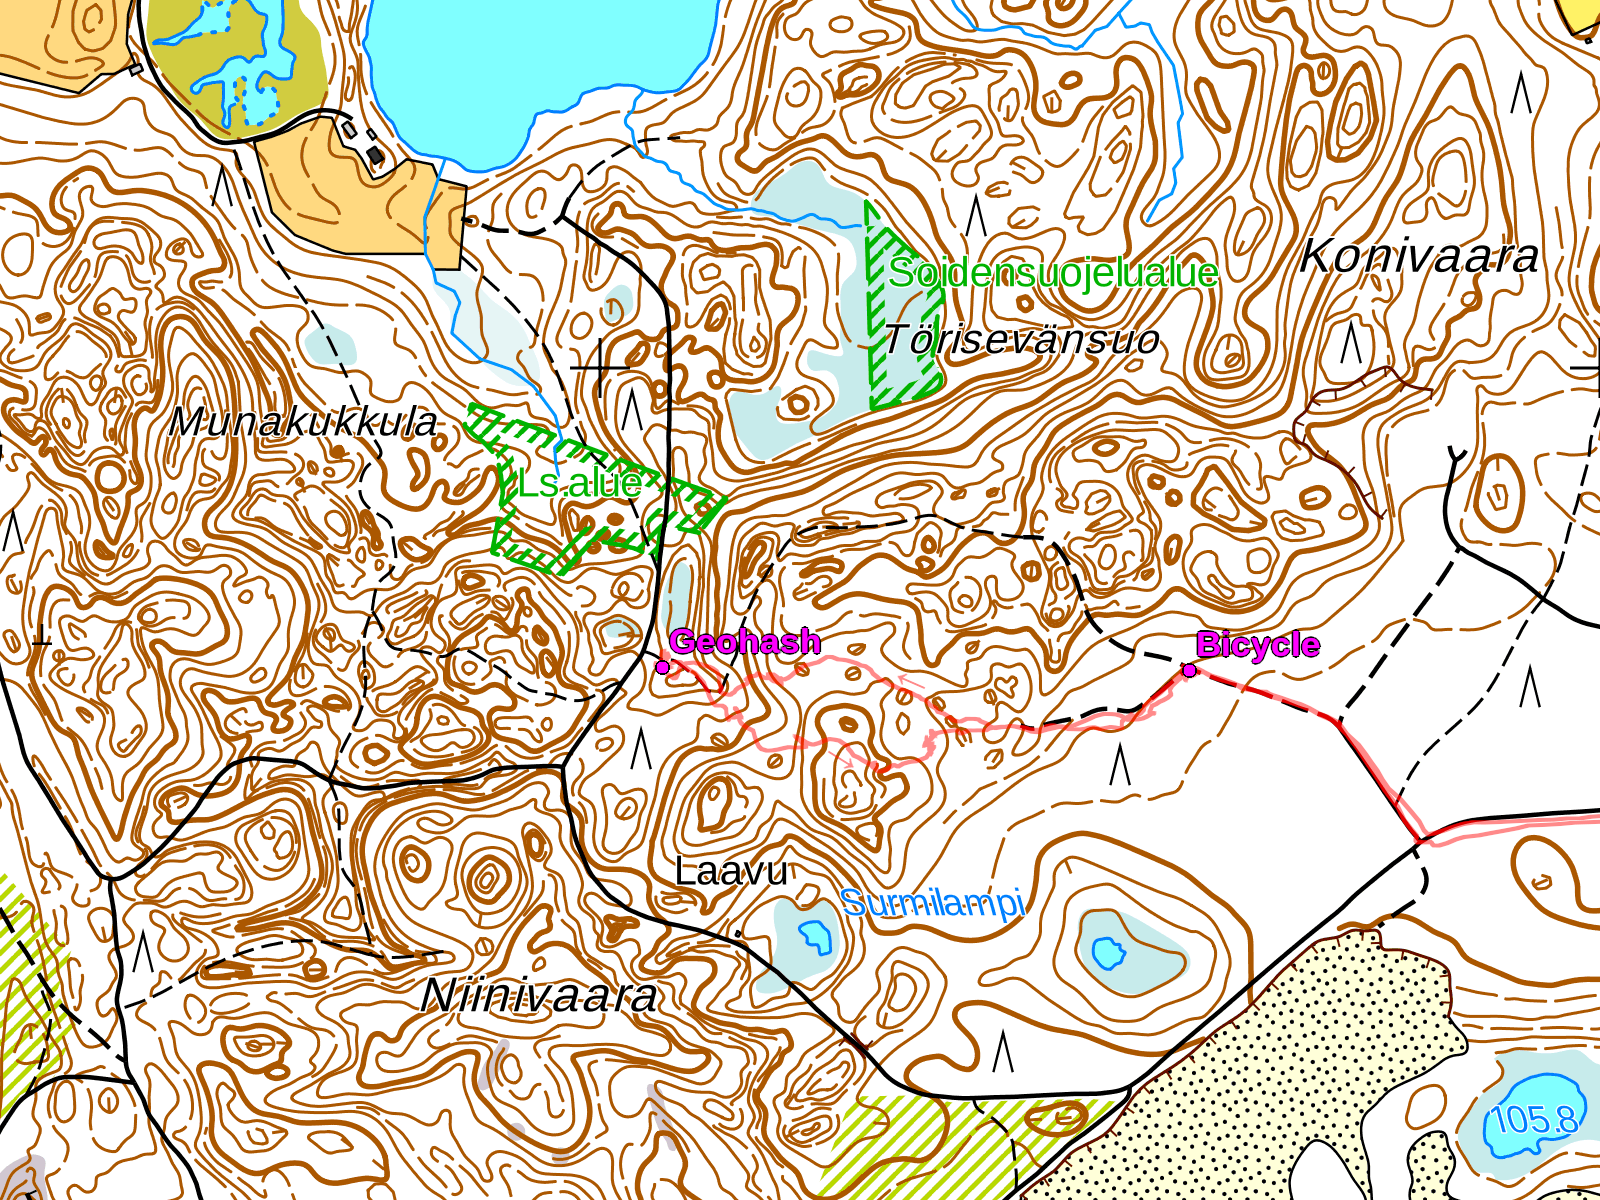
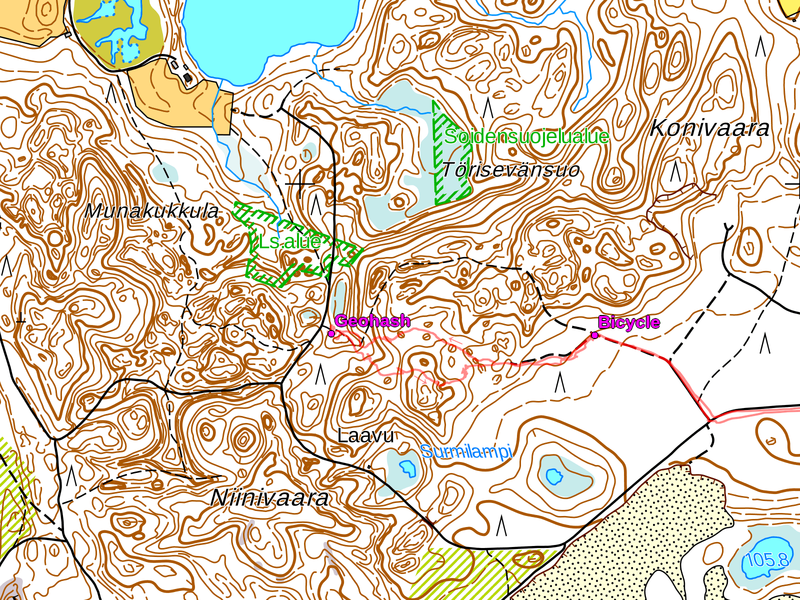
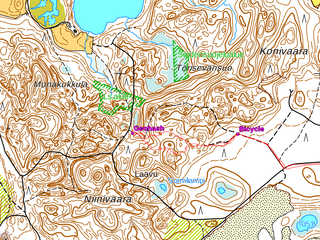
For those who do not know contour lines, they represent lines of constant elevation, and elevation difference between adjacent contour lines is five metres. The more contour lines there are, the more uneven the terrain is, and the closer the contour lines are together, the steeper the slopes are in the terrain. Therefore you can see that I was luckily in a relatively easy area.
Map data: Basic map raster by National Land Survey of Finland, downloaded 2020-04-29.
File history
Click on a date/time to view the file as it appeared at that time.
| Date/Time | Thumbnail | Dimensions | User | Comment | |
|---|---|---|---|---|---|
| current | 17:59, 29 April 2020 | | 1,600 × 1,200 (976 KB) | Kripakko (talk | contribs) | Category: Meetup on 2020-04-29 Category: Meetup in 62 29 |
- You cannot overwrite this file.
File usage
The following page links to this file: