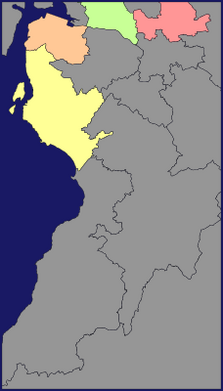
m (→55, -4 | 20% Claimed) |
m (Adding Map of Graticules) |
||
| Line 94: | Line 94: | ||
|<span style="color:rgb(150, 150, 150)">■</span> Falkirk||N/A||0.058% | |<span style="color:rgb(150, 150, 150)">■</span> Falkirk||N/A||0.058% | ||
|- | |- | ||
| − | |<span style="color: | + | |<span style="color:rgb(25, 25, 100)">■</span> Other / Unknown||N/A||0.80% |
|} | |} | ||
| Line 127: | Line 127: | ||
|<span style="color:rgb(150, 150, 150)">■</span> City of Edinburgh||N/A||0.0091% | |<span style="color:rgb(150, 150, 150)">■</span> City of Edinburgh||N/A||0.0091% | ||
|- | |- | ||
| − | |<span style="color: | + | |<span style="color:rgb(25, 25, 100)">■</span> Other / Unknown||N/A||4.4% |
|} | |} | ||
| + | |||
| + | == Map of Graticules == | ||
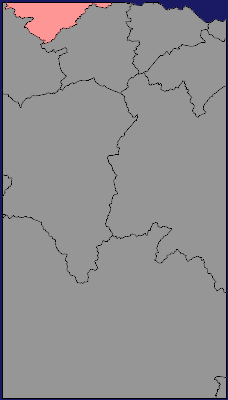
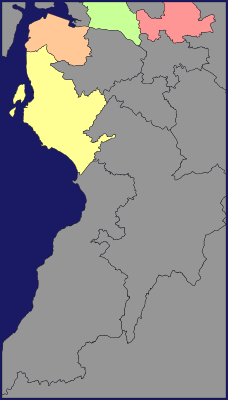
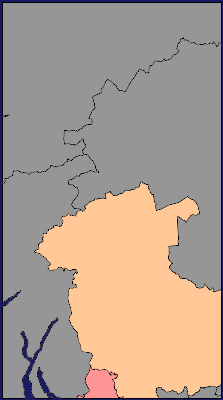
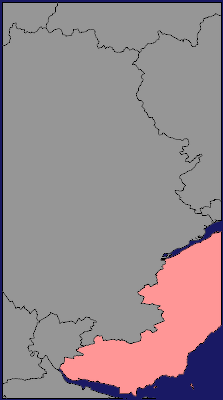
| + | Hover over the graticule image to see graticule coordinates (alt text). | ||
| + | |||
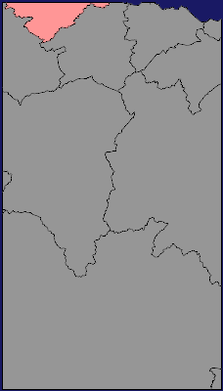
| + | [[File:KerrMcF 56 -4 Regions.svg|56,-4]][[File:KerrMcF 56 -3 Regions.svg|56,-3]] <br> | ||
| + | [[File:KerrMcF 55 -4 Regions.png|223px|55,-4]][[File:KerrMcF 55 -3 Regions.svg|223px|55,-3]] | ||
Revision as of 20:41, 29 March 2024
Contents
What is this?
This page uses Kripakko's Gracticule Partitioner to generate svg files for graticules I have successfully geohashed in. The images displayed will have regions coloured in if I have geohashed in them and will be grey if not. Linked below each image will be the first successful geohash in each region. Large bodies of water are added to the claimed percentage in the headings.
Reverse Regional Images
55, -3 | 3.1% Claimed
| Name | First Geohash |
Land Coverage |
|---|---|---|
| ■ Dumfries and Galloway | N/A | 38.0% |
| ■ Scottish Borders | N/A | 20.0% |
| ■ South Lanarkshire | N/A | 19.5% |
| ■ West Lothian | N/A | 6.2% |
| ■ North Lanarkshire | N/A | 4.4% |
| ■ Midlothian | N/A | 4.1% |
| ■ City of Edinburgh | N/A | 3.9% |
| ■ Falkirk | Link | 2.2% |
| ■ East Lothian | N/A | 0.35% |
| ■ Cumberland | N/A | 0.22% |
| ■ East Ayrshire | N/A | 0.15% |
| ■ Water | N/A | 0.90% |
55, -4 | 26.6% Claimed
| Name | First Geohash |
Land Coverage |
|---|---|---|
| ■ Dumfries and Galloway | N/A | 18.1% |
| ■ East Ayrshire | N/A | 17.9% |
| ■ South Ayrshire | N/A | 17.0% |
| ■ North Ayrshire | Link | 6.6% |
| ■ South Lanarkshire | N/A | 5.8% |
| ■ Renfrewshire | N/A | 3.9% |
| ■ Glasgow City | N/A | 2.5% |
| ■ Inverclyde | Link | 2.5% |
| ■ East Renfrewshire | N/A | 2.5% |
| ■ East Dunbartonshire | Link | 2.2% |
| ■ North Lanarkshire | N/A | 2.1% |
| ■ West Dunbartonshire | N/A | 1.7% |
| ■ Argyll and Bute | N/A | 1.5% |
| ■ Stirling | N/A | 0.49% |
| ■ Other / Unknown | N/A | 15.3% |
56, -4 | 30.95% Claimed
| Name | First Geohash |
Land Coverage |
|---|---|---|
| ■ Stirling | N/A | 29.2% |
| ■ Highland | N/A | 25.7% |
| ■ Perth and Kinross | N/A | 25.1% |
| ■ Argyll and Bute | N/A | 17.5% |
| ■ West Dunbartonshire | Link | 0.95% |
| ■ North Lanarkshire | N/A | 0.29% |
| ■ East Dunbartonshire | N/A | 0.28% |
| ■ Falkirk | N/A | 0.058% |
| ■ Other / Unknown | N/A | 0.80% |
56, -3 | 17.3% Claimed
| Name | First Geohash |
Land Coverage |
|---|---|---|
| ■ Perth and Kinross | N/A | 54.1% |
| ■ Fife | Link | 12.9% |
| ■ Angus | N/A | 12.1% |
| ■ Aberdeenshire | N/A | 6.8% |
| ■ Stirling | N/A | 2.9% |
| ■ Clackmannanshire | N/A | 2.4% |
| ■ Falkirk | N/A | 2.2% |
| ■ Highland | N/A | 1.6% |
| ■ Dundee City | N/A | 0.35% |
| ■ West Lothian | N/A | 0.019% |
| ■ North Lanarkshire | N/A | 0.010% |
| ■ City of Edinburgh | N/A | 0.0091% |
| ■ Other / Unknown | N/A | 4.4% |
Map of Graticules
Hover over the graticule image to see graticule coordinates (alt text).
