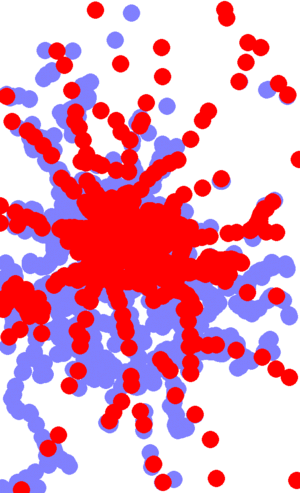
Public transport probability
This program uses OpenStreetMap data to calculate the chance of a hashpoint lying within X kilometres of a train station or bus stop.
Usage
First, get the OpenStreetMap extract for your graticule (replace 52,13 below with your own graticule).
$ wget 'http://www.informationfreeway.org/api/0.6/node[bbox=13,52,14,53][railway=station|stop|halt|tram_stop]'
$ wget 'http://www.informationfreeway.org/api/0.6/node[bbox=13,52,14,53][highway=bus_stop]'
The first command retrieves all stations and on-request halts. Usually it includes surface rail, underground services and trams. The second retrieves all bus stops.
Next, create a PHP file with the code below, editing the first few lines as appropriate. Run it to create an image file and to output the probabilities. For the first run, I suggest making the $distance very small so you can check whether the OSM data looks complete.
NB: Untested on negative graticules, let me know if you have problems!
Example
For the Berlin, Germany (52,13) graticule:
david@netman1:~/geohashing/berlin$ php process.php
Graticule size: E-W: 67.6534534537 km, N-S: 111.13296 km
Image resolution: 608, 1000
5km ellipse is: 89.8697655422, 89.9823058794
Total pixels: 608000
Train pixels: 417707
Bus pixels: 79080
Chance of train within 5km: 68.70%
Chance of train or bus within 5km; 81.71%
Code
<?php /* -*- C++ -*- */

// Calculates the probability of a hashpoint landing within X km of public transport
// See http://wiki.xkcd.com/geohashing/Public_transport_probability
//
// by David Croft, http://wiki.xkcd.com/geohashing/User:Davidc
// no copyright, released into the public domain


// Your downloaded OSM files
$bus_file = 'node[bbox=13,52,14,53][highway=bus_stop]';
$train_file = 'node[bbox=13,52,14,53][railway=station|stop|halt|tram_stop]';

// Output image file
$outfile = 'out.gif';

// Your graticule
$lat_min = 52; // n/s
$lon_min = 13; // e/w

// Distance to search in kilometres.
$distance = 2;

// You shouldn't need to edit anything below this line.

// Top right of the graticule
$lat_max = $lat_min + 1;
$lon_max = $lon_min + 1;

// Centre of the graticule.
$lat_centre = ($lat_min + $lat_max) / 2;
$lon_centre = ($lon_min + $lon_max) / 2;

// Spans (normally 1 unless you edit above)
$lat_span = $lat_max - $lat_min;
$lon_span = $lon_max - $lon_min;

// Graticule is rectangular using Mercator projection.

// All graticules are the same height.
$yres = 1000;

// <ekorren> north-south is always 60*1.852216 (because that's how the nautical mile is defined)
$ns_km = 60*1.852216;

// <ekorren> east-west is     39940.638 / 360 * cos($lat / 180 * 3.1415926) km
//$ew_km = 39940.638 / 360 * cos(deg2rad($lat_centre / 180 * M_PI));

// Wikipedia formula:
$ew_km = (M_PI / 180) * cos(deg2rad($lat_centre)) * 6367.449;

echo "Graticule size: E-W: $ew_km km, N-S: $ns_km km\n";

$xres = (int)($yres * ($ew_km/$ns_km));

echo "Image resolution: $xres, $yres\n";

// Now, what is $distance at this latitude?
$ellipse_x = 2 * $xres * $distance / $ew_km;
$ellipse_y = 2 * $yres * $distance / $ns_km;

echo "${distance}km ellipse is: $ellipse_x, $ellipse_y\n";

// Create image and allocate colours
$img = ImageCreate($xres, $yres) or die();

$bg_col = ImageColorAllocate($img, 255,255,255);
$bus_col = ImageColorAllocate($img, 128, 128, 255);
$train_col = ImageColorAllocate($img, 255, 0, 0);

// Draw buses, then draw trains on top
draw_points($img, $bus_file, $bus_col);
draw_points($img, $train_file, $train_col);

// Output image
ImageGIF($img, $outfile);

// Now count pixels
// TODO adjust the weight of a pixel depending on its latitude (above the equator, higher
// pixels should have less effect on % because the physical width is less).

$total_pixels = $xres * $yres;
$train_pixels = 0;
$bus_pixels = 0;

for ($x = 0; $x < $xres; ++$x) {
  for ($y = 0; $y < $yres; ++$y) {
    $col = ImageColorAt($img, $x, $y);
    if ($col == $train_col)
      $train_pixels ++;
    else if ($col == $bus_col)
      $bus_pixels ++;
  }
 }

echo "Total pixels: $total_pixels\n";
echo "Train pixels: $train_pixels\n";
echo "Bus pixels: $bus_pixels\n";
echo "Chance of train within ${distance}km: "
  . number_format(100 * $train_pixels / $total_pixels, 2) . "%\n";
echo "Chance of train or bus within ${distance}km; "
  . number_format(100 * ($train_pixels + $bus_pixels) / $total_pixels, 2) . "%\n";
exit;


function draw_points($img, $file, $col)
{
  global $lon_min, $lon_span;
  global $lat_min, $lat_span;
  global $xres, $yres;
  global $ellipse_x, $ellipse_y;

  $doc = new DOMDocument();
  $doc->load($file) or die();

  $xpath = new DOMXpath($doc);
  $nodes = $xpath->query('/osm/node');

  for ($i=0; $i<$nodes->length; ++$i) {
    $node = $nodes->item($i);

    $lat = $node->getAttribute('lat');
    $lon = $node->getAttribute('lon');

    $x = $xres * (($lon - $lon_min) / $lon_span);
    $y = $yres - ($yres * (($lat - $lat_min) / $lat_span));

    ImageFilledEllipse($img, $x, $y, $ellipse_x, $ellipse_y, $col);
  }
}
