Peoria, Illinois/Land Usage
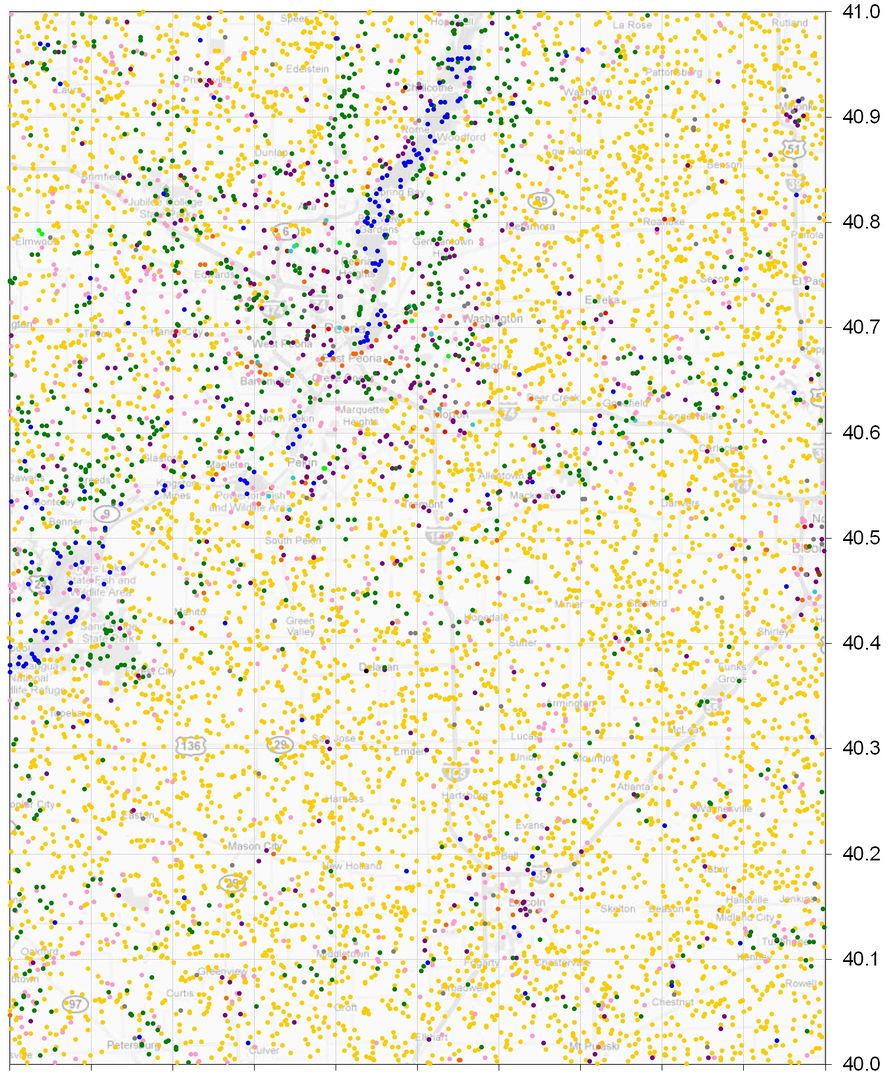
After having finished the Regional Geohash maps for the 50 United States, I thought about the next big thing I could work on. I was intrigued by the Land usage code that some graticules used to map out what's in their area. Instead of going that way, I decided to do a more empirical approach, and see where the geohashes have fallen in the Peoria graticule since 2000-01-01. I worked on and off over the last year to look individually at each daily geohash (>4000 days for the initial 11 years), and log the coordinates and what type of land it was. I organized everything in an Excel spreadsheet and graphed the results, seen below. --Dvdllr 12:08, 20 July 2011 (EDT)
As of 2011-07-20, there have been 4219 locations since 2000-01-01.
Color key, in descending order of frequency:
| Color | Type | Count | Percent |
|---|---|---|---|
| Yellow | farms/crop fields | 2955 | 70.04% |
| Dark green | forests/woods | 484 | 11.47% |
| Pink | grass/dirt/open space | 307 | 7.28% |
| Purple | residential property | 199 | 4.72% |
| Blue | water | 123 | 2.92% |
| Grey | roads | 73 | 1.73% |
| Orange | businesses | 53 | 1.26% |
| Aqua | parking lots | 8 | 0.19% |
| Red | schools/colleges | 6 | 0.14% |
| Bright green | golf courses | 5 | 0.12% |
| Black | railroads | 4 | 0.09% |
| Brown | cemeteries | 2 | 0.05% |
