Contents
[hide]Interactive Map of All Expeditions
Fippe's map
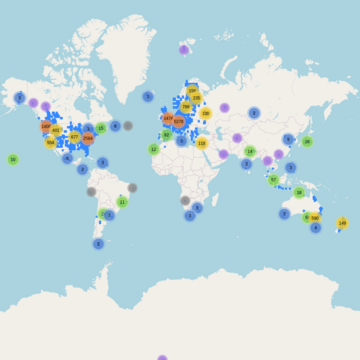
Shows a world map with a marker for each expedition in Category:Expeditions, and graticule borders if there has been an expedition in the graticule. Expeditions are grouped in clusters which dissolve when you click on them or zoom in. Expeditions in Category:Coordinates reached are colored purple, others are colored grey. Click on the marker to see the name and participants of the expedition.
The map can be filtered by appending a comma-separated string to the URL. It is possible to search by user, year or outcome, or any combination of those.
| Parameter | Possible values | Example-URL |
|---|---|---|
| User | Any username at this wiki, unless the username contains commas, is a year, or "reached", or "not reached". Substitute spaces with underscores. | https://fippe.de/all?Felix_Dance |
| Year | A four-digit number between 2008 and the current year. | https://fippe.de/all?2021 |
| Outcome | "reached" or "not_reached" | https://fippe.de/all?not_reached |
| Combination | Any of the above separated by commas | https://fippe.de/all?2021,Felix_Dance,reached https://fippe.de/all?2021,Felix_Dance https://fippe.de/all?Felix_Dance,not_reached https://fippe.de/all?2021,not_reached |
geohashing.win
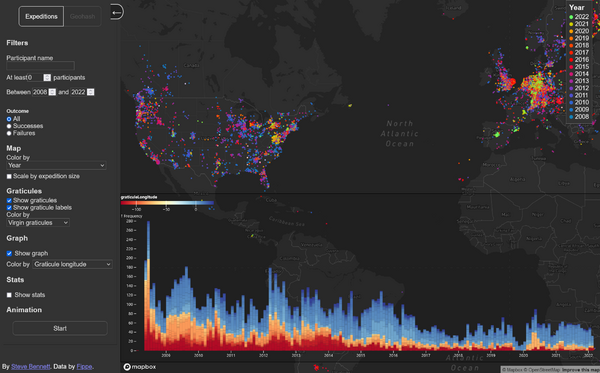
This map uses data from Fippe's server, but with some user controls and more emphasis on data visualisation. It has lots of features:
- Shows graticules, expeditions, today's geohash
- Filter expeditions by: participant name, number of participants, year, success/failure
- Color-code expeditions by: year, month, day of the week, experience level of participants, participant name
- Scale expeditions by number of participants
- Color-code graticules by: locked/unlocked, number of expeditions, success ratio
- Graph expeditions over time, broken down by: success/failure, longitude, latitude, number of participants, participant names, graticule name, country
- View animation of expeditions over time
- See list of top geohashers in the current area.
Created and maintained by Stevage.
Most active Geohashers
- Most active Geohashers - wiki statistics on user activity, updated daily
- Most active Geohashers/old - other wiki statistics on user activity, currently not updated
Most active graticules
- Most active graticules - wiki statistics on Expeditions and Coordinates reached, updated daily
Most active countries
- Most active countries - wiki statistics on country activity, updated daily
Longest streaks
- Longest streaks - lists all streaks by the entire community for at least 50 consecutive days
Closest pairs
- Closest pairs - lists pairs of successful expeditions very close to each other physically.
Probability Calculator
If you live in a difficult graticule with inaccessible terrain or ocean, this on-line calculator is handy for working out probabilities.
For example, the Norwich graticule is 57% land so the daily probability of a land geohash is 0.57. In a 30 day month, the probabilities of getting land hashpoints can be calculated.
|
Number of land hashpoints >= |
Probability |
|
5 |
0.9999999 |
|
10 |
0.997 |
|
15 |
0.83 |
|
20 |
0.19 |
|
25 |
0.002 |
|
30 |
0.000000047 |
No longer updated
World map of All Graticules
Not updated since 2019 - see geohashing.win for similar functionality
User:dawidi has written a geohashing statistics generator. It reads some wiki pages, and currently outputs a few static html pages. Thanks to the folks on #geohashing for their positive feedback and constructive criticism :)
If you're curious, the program is written in C#/.NET 2.0 without any extra libraries. It's a scheduled task on my server, updating the statistics once a week, on Tuesday at 10:45 CE(S)T.
Shows which graticules have been named, and which have their own wiki pages.
Graticule names and positions are read from the world region pages at Category:All graticules. A graticule that doesn't have a page is considered to be sea and colored blue if it has its own lat, lon in the name.
(Notice the graticules have links and title texts.)
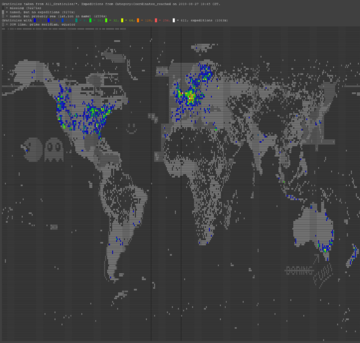
World map of Successful Expeditions
Not updated since 2019 - see geohashing.win for similar functionality
Shows graticules colored by number of documented successful hash visits (from Category:Coordinates_reached). The color gradient used is nonlinear, so differences between graticules with few visits are easier to see. Unsuccessful expeditions are not counted, as those categories seem to include a lot of planned expeditions that did not take place after all.
Also includes the named and named/sea graticules from the world region pages at Category:All graticules in a brighter gray.
(Notice the graticules have links and title texts.)
Global Activity by week
Not updated since 2019 - see geohashing.win for similar functionality
Shows bar graphs of the number of successful visits per week, both for the entire globe and for each continent.
The continent "outlines" are, for the moment, simply 6 rectangular blocks of graticules covering the entire globe (see bottom of the page for the exact sizes), so the breakdown may not be useful for e.g. Antarctica, and may assign some obscure regions to the wrong continent. The edges were chosen such that all 2008 expeditions are counted for the correct continent. The 2009 expeditions in Israel are currently counted for Africa, but I'm too lazy to refine the region borders at the moment.
(I know it lacks a scale, but look at the title texts for numbers.)
"Global village" graticule
Not updated since 2019
Generated from a user-contributed list at Maps and Statistics/User Fractions, it's a rendering of geohasher locations around the world, but mapped onto one square graticule, so people who live in the same corner of their respective graticules, but in an entirely different graticule, will end up close to each other. I suppose distances on that map will indicate how likely it is for people to do expeditions (to hashes near their homes) on the same day, not how likely they are to meet.
Yes, it's difficult to explain and a ridiculous concept... the idea arose from regularly attending the zbot summoning ceremony in #geohashing, after which we usually start voicing our opinions about the new coordinates and wildly disagreeing about whether they are "good" or "bad", depending on where each of us lives relative to the grid :-)
Geohasher age/sex demographics
Not regularly updated
An age-sex pyramid graph showing the distribution of age groups among geohashers (at least those using valid ASG templates).
After complaints that the categorising of hashers into m and f was too restrictive, the script now accepts ASGs with other values for the gender parameter as well and lists them in green :-)
Also, people who give their age as negative (or their birthday as a date in the future) or who are over a hundred years old will be listed under "invalid age", independent of gender. (May be changed if time travel is implemented or the Old Geohash record reaches 90.)
Most active graticules
Not updated since 2019 - see Most active graticules instead.
- Most active graticules/old - other wiki statistics on Expeditions and Coordinates reached, updated most days
- Most active graticules - An offsite table showing the 15 most active graticules (highest number of expeditions from Category:Coordinates reached and Category:Coordinates not reached) for each month, year and overall. If there are graticules with equal activity, they are ordered by latitude and longitude.
Most successful graticules
Not updated since 2019
- Most successful graticules - An offsite table showing the 15 most active graticules (highest number of expeditions from Category:Coordinates reached) for each month, year and overall. If there are graticules with equal activity, they are ordered by latitude and longitude.
Not working at all
Interactive Map of All Expeditions
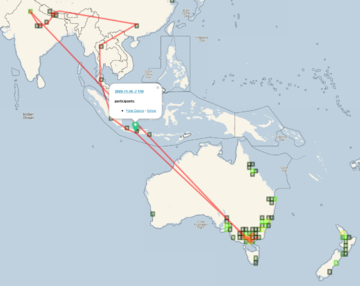
Shows a slippy map with all graticules that have expedition reports. The colour scheme represents number of attempted expeditions.
- Clicking on a graticule reveals some statistics about the graticule, and displays markers for all expeditions in this graticule.
- Clicking on a marker reveals the participants of the expedition (as far as they have registered user names in the wiki, and are recognizable from the expedition report by double-fuzzy logic).
- Each user name is accompanied by a "follow" link, which traces a line through all geohashes visited by the user (as per the above logic)
If you want to link directly to regions on this map, it also supports parameters. (Example)
- lat, lon, zoom - center the map on a given latitude and longitude, at a given zoom level
- follow - display the trace for a given user by default (capitalization must match the wiki user name)
Note: geohashing.win has very similar functionality, so try that one now.


